Navigation Guides
Practical guides designed to help users explore and use GloMIP's main portals and tools effectively, including tips on accessing features, interpreting data, and navigating dashboards.
Impact Opportunities Navigation Guide
Within the CGIAR context, Impact Opportunities can be defined as a subset of development needs. Often, impact opportunities lie along the intersection of crop production, consumption, and underdevelopment. The CGIAR's GloMIP Impact Opportunities Portal mainly aids in identifying target areas. To date, the Impact Opportunities dashboard offers over 200 indicators for over 40 crops being cultivated in 200 countries. This page aims to teach users how to navigate through the portal.
Disclaimer: Users may notice that the dropdown filter selection in the Impact Opportunities portal mostly contains National (e.g., National, National-crop) or Market (e.g., Market Segment, MS Subregion) prefixes. The former pertains to data derived or generated from the FAO, while the latter is with respect to the CGIAR Market Intelligence. Variability in the selection outcome may be experienced as a result.
The Impact Opportunities Portal mainly tracks five (5) key Impact Areas: Nutrition, health & food security, Poverty reduction, livelihoods & jobs, Gender equality, equality, youth & social inclusion, Climate adaptation & mitigation, and Environmental health & biodiversity.
Several indicators can be used to quantify the level of underdevelopment within each Impact Area, which helps identify countries or crops on which to focus development efforts. Results are presented through figures and tables.
Details regarding the available indicators can be found in the Indicator Catalog. Symbols are attached after the name, which serves as a guide to the following information:
Depending on the user’s query, the Impact Opportunities Portal offers various methods of comparing absolute and relative values across regions, countries, crops, market segments, and traits. These methods may use a single or multiple indicators. Below are the tabs that can be used in the dashboard:
The succeeding section of the guide presents two hypothetical scenarios where the Impact Opportunities Portal is applied to generate evidence. These scenarios suggest specific filter settings for discussion purposes. As such, these selections should not be considered the only options available.
Scenario 1: Identifying potential target countries for low glycemic index rice to regulate the incidence of type 2 diabetes (Single Indicator).
Premise: Identifying countries with rice as a main staple and a substantial number of their population experiencing type 2 diabetes can be identified as priority countries. As such, the Impact Opportunities Portal can be used to fill in this information.
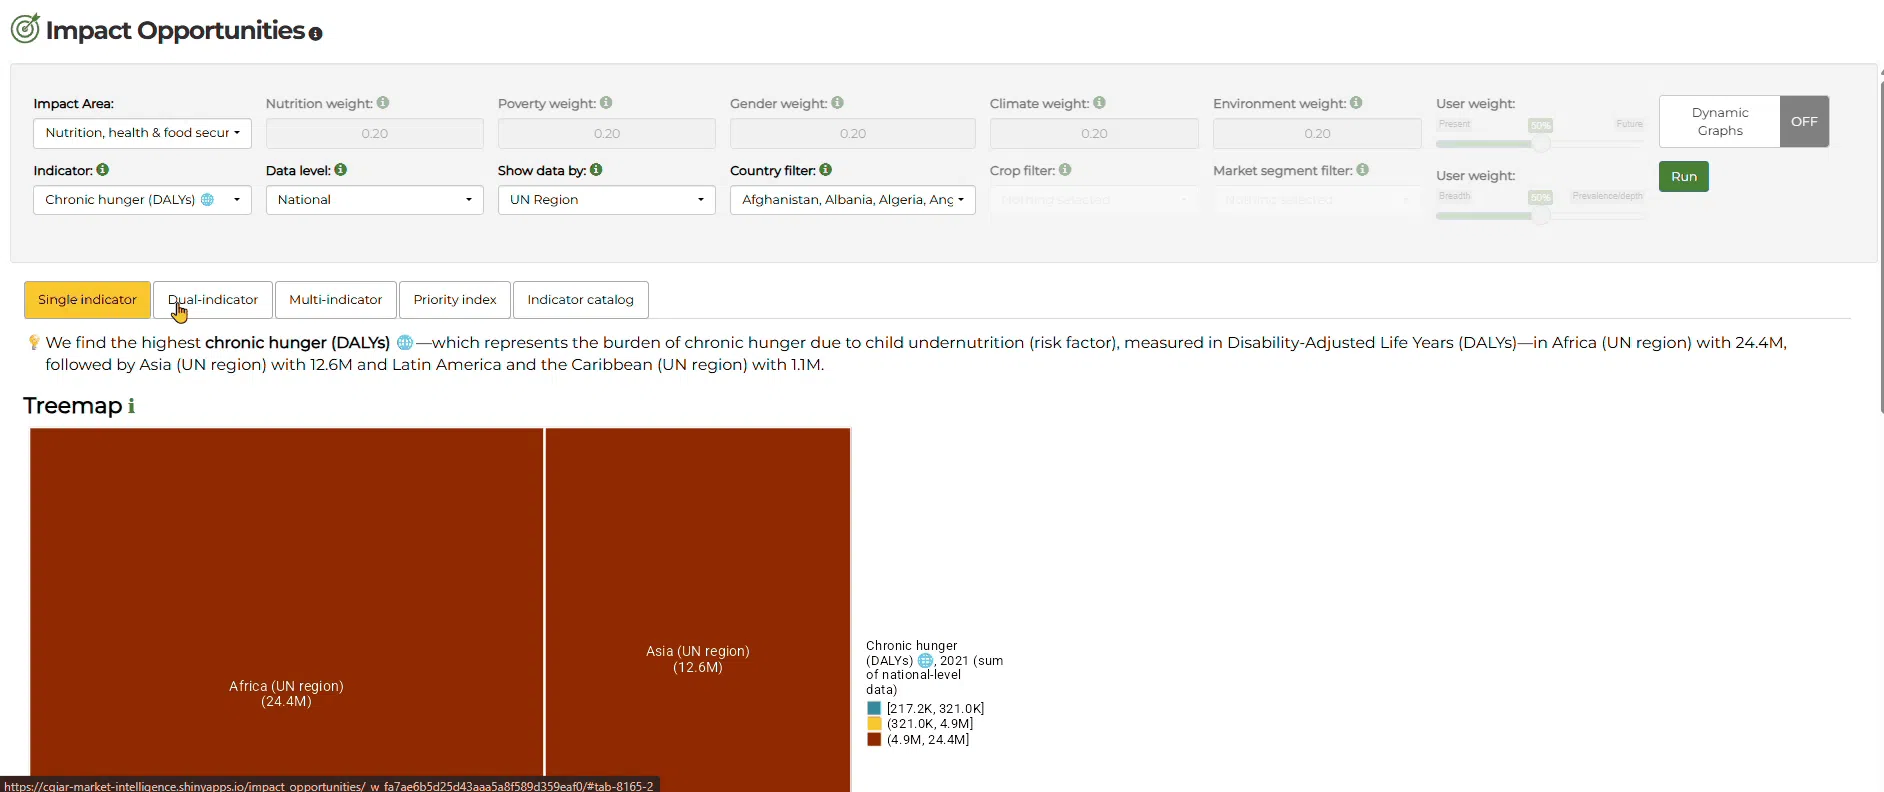
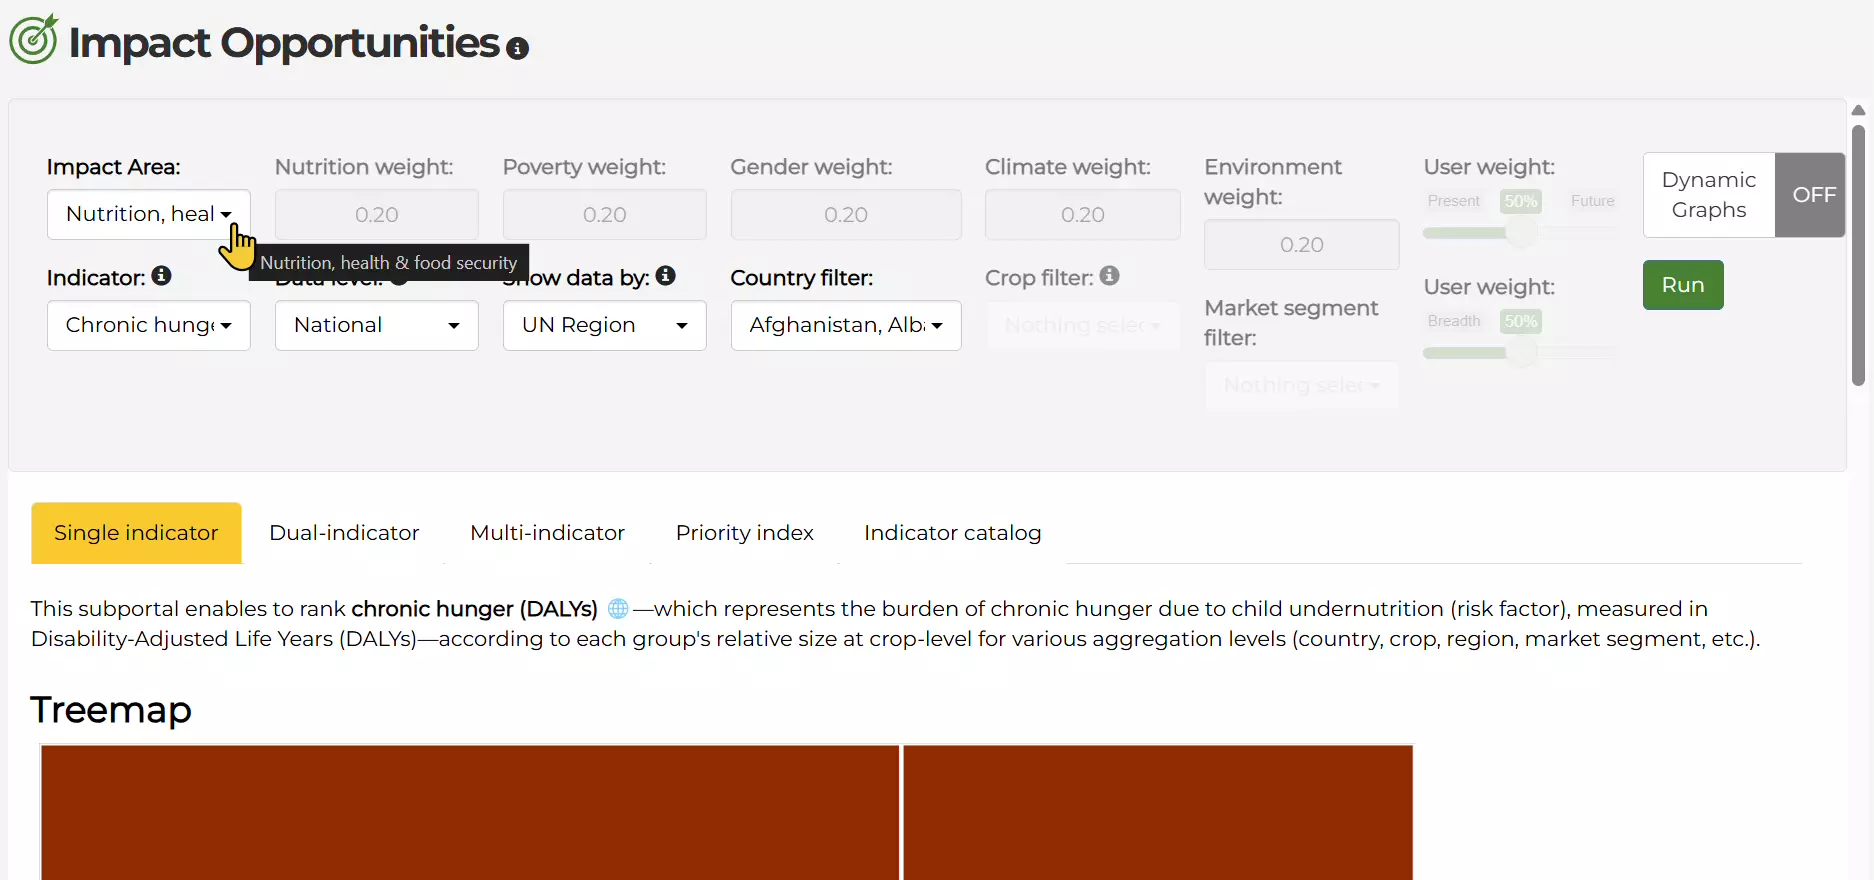
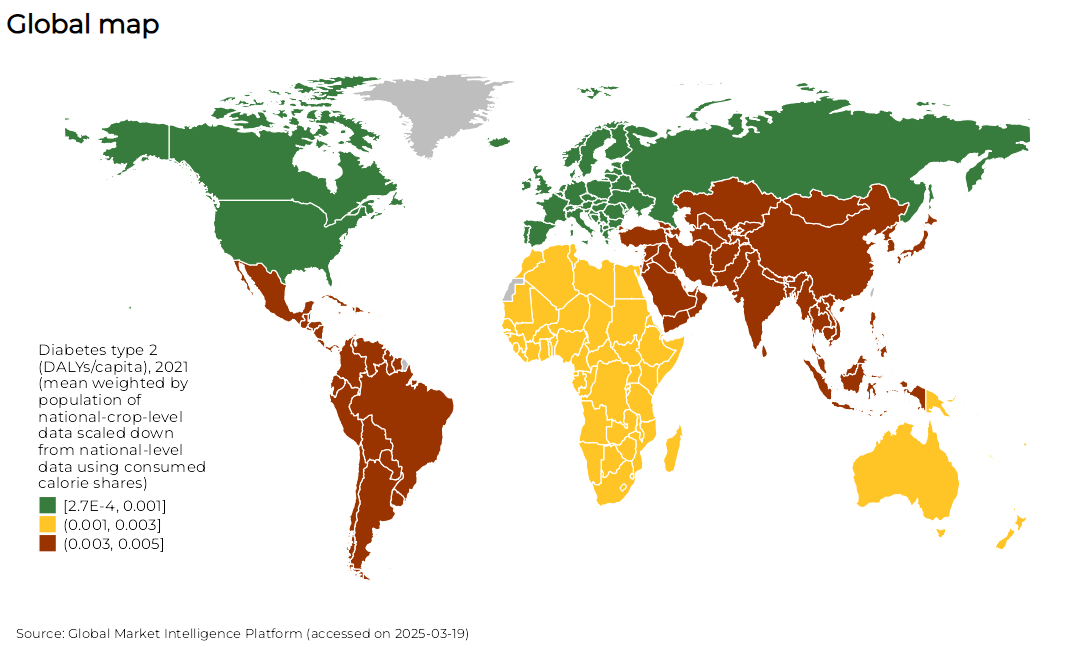
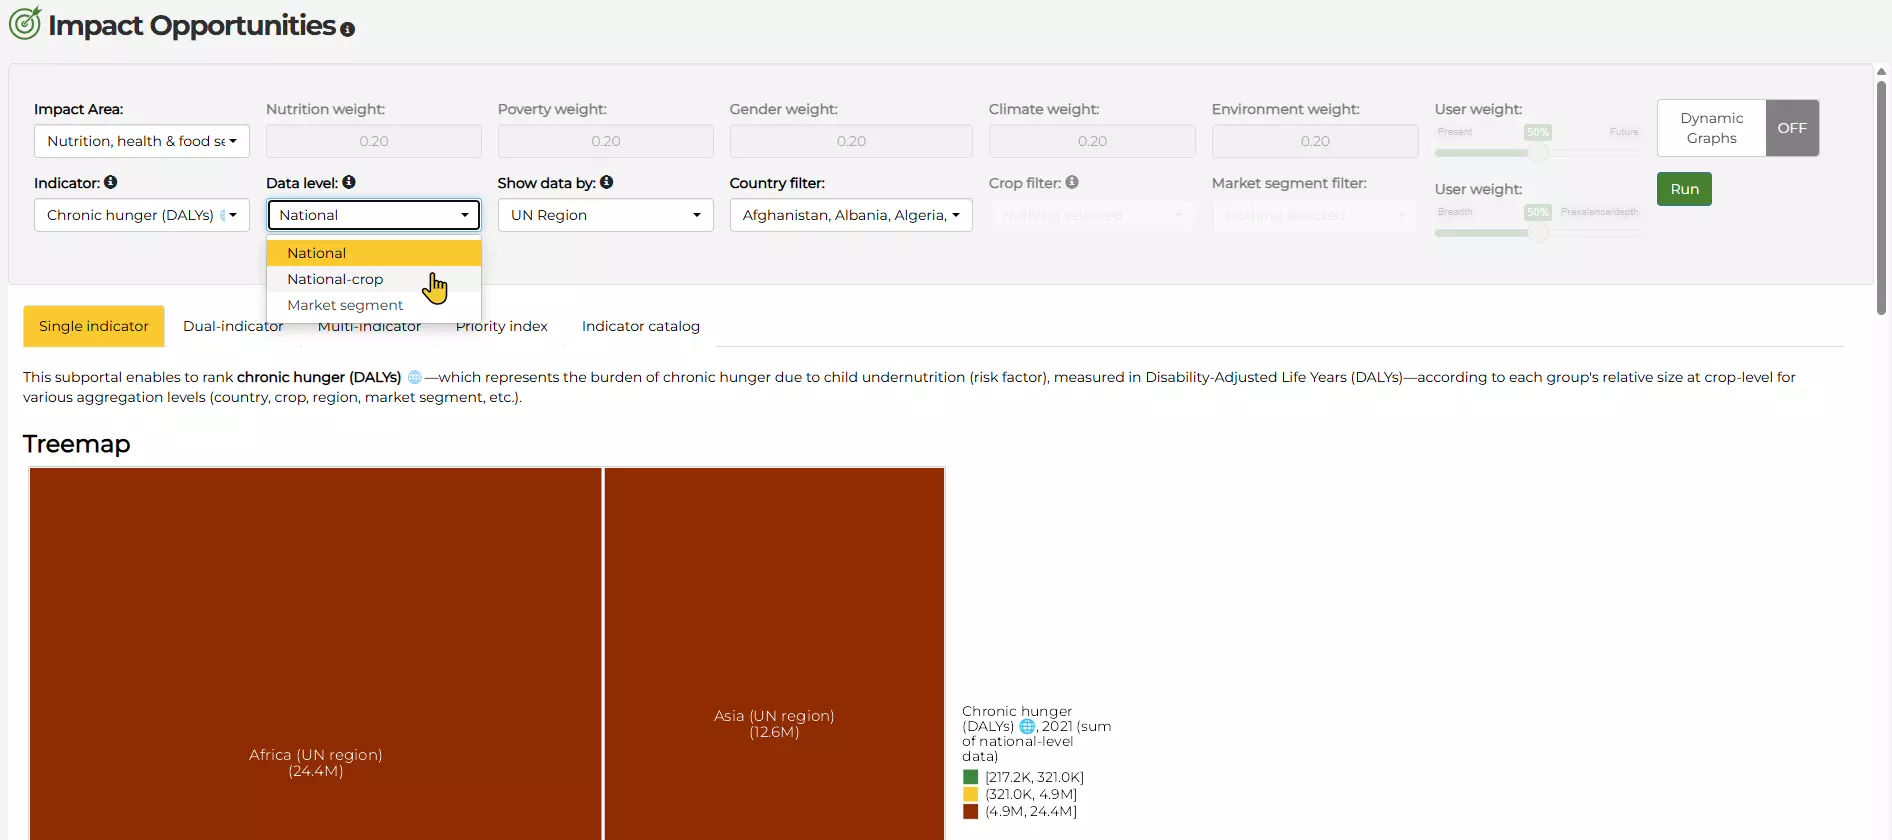
From the Impact Opportunities Portal, select Nutrition, health & food security as an Impact Area, Diabetes type 2 (DALY/capita) as an Indicator, National-crop for Data Level, and Rice for Crop filter.
Note
You can select indicators by scrolling through the dropdown selection using the scroll bar or by typing your query in the search box. For ease of use, most of the dropdown menus within the Impact Opportunities dashboard have selection functions, such as select all and deselect all. It should be noted that, by default, Users should press the Deselect All button before selecting a subset of the available entries.
Some filter selections are given depending on the user's selection. For example, if you identified National-crop for the Data-level filter, the user is consequently given the option to identify crops to be assessed under the Crop filter.
Spread across the Impact Opportunities Portal are “i” icons. This are placed to provide users with information about the filter
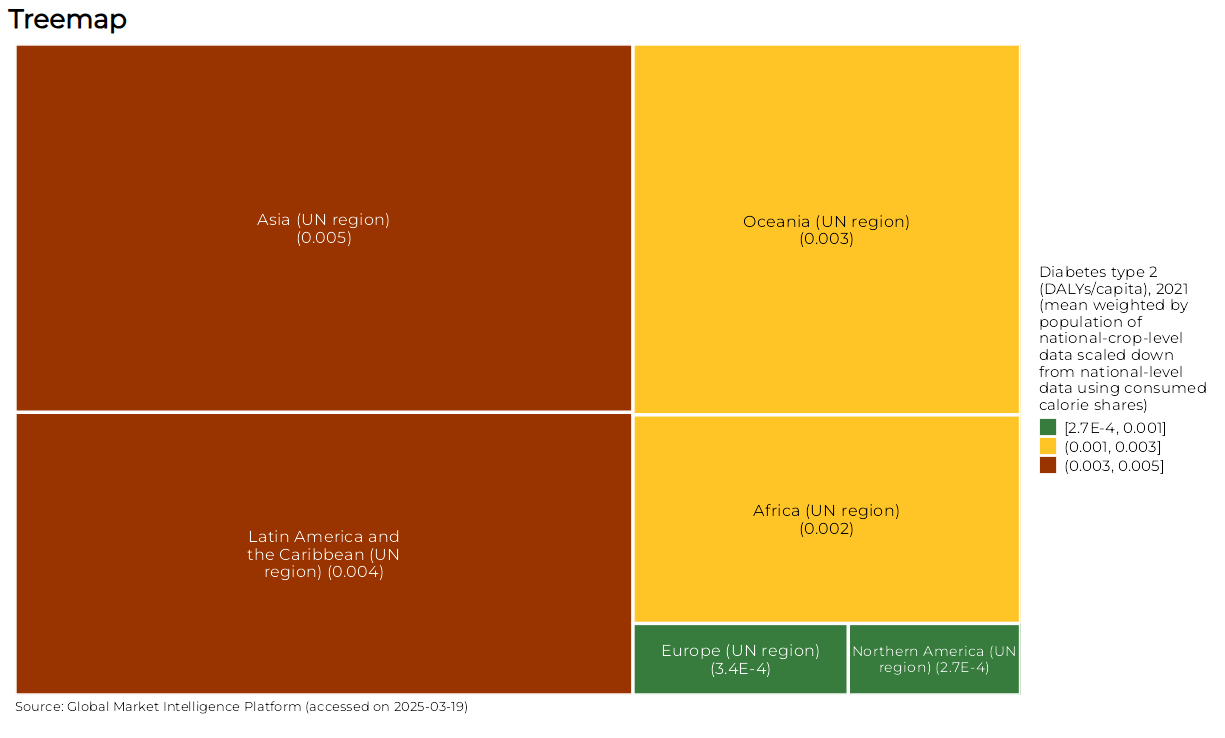
Selected results for Scenario 1 are presented in a Treemap, Global Map, and Data Table. The Treemap shows the results by the size of the rectangles proportional to the value differences. From the filter selection, it can be observed that Asia, Latin America, and the Caribbean (LAC) were the regions identified to have high values.
The Global map visually represents the geographic coverage, depending on the selection filters. The results of the filter selection highlight Asia and LAC in red. In contrast, Oceania and Africa are identified to have a medium concern for type 2 diabetes, which signifies the Yellow highlight for these regions.
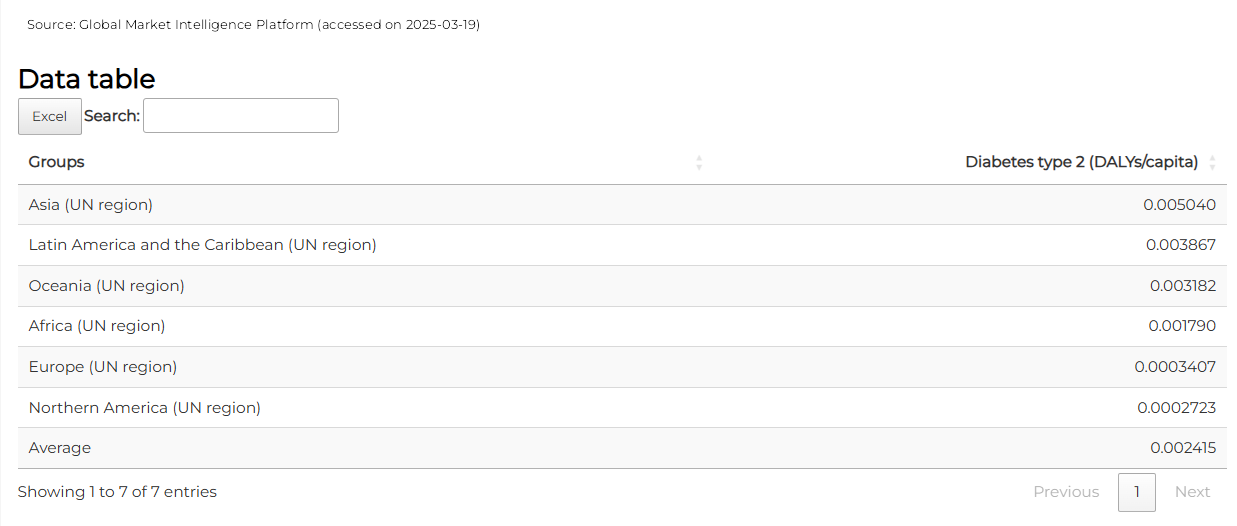
The Data table presents the numeric valuation of the filter selection. The results are arranged by default in descending order, with the highest value at the top. Depending on the selected indicator, the aggregation value may be an average (summation over the total observations) or total (sum of observations). Users can easily download the results of the Data table by clicking the Excel button found at the top of the Data table.
Scenario 2: Strategically manage the allocation of CGIAR’s financial resources for crop breeding (Priority Index)
Premise: Developing new crop varieties requires substantial financial resources. Determining Impact Opportunities guides decision-makers in deciding priorities.
To answer this question, we can set the Impact Opportunities dashboard to the Priority Index tab and set the following filters to the following:
Note
The Priority Index tab of the Impact Opportunities dashboard offers weights in the tab’s toolbar to control how the indicators are valued. Currently, there are two groups of weight filters in the dashboard bar.
-
The Impact Area weights give the users control over how to value each impact area before generating the priority index score. For example, the user can set Poverty to 0.6 and the other impact areas 0.1 to assign more value or priority to poverty reduction initiatives.

-
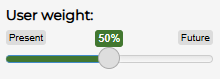
The present versus future user weight refers to the slider that controls the proportion of “Present” and “Future” Indicators used to compute the Priority Index. This function allows the user to limit or remove Indicators that contribute to a more “present-looking” or “future-looking” index score.
-
A breadth versus prevalence user weight controls the proportion of Indicators representing breadth or prevalence. Breadth indicators can be referred to as absolute indicators that quantify the magnitude of underdevelopment. An example of this type of indicator is the population in poverty. Meanwhile, Prevalence indicators represent relative values, irrespective of the target’s size, such as the proportion of the population in poverty.
- Setting a user weight to 50% indicates pushes the dashboard without exclusions.
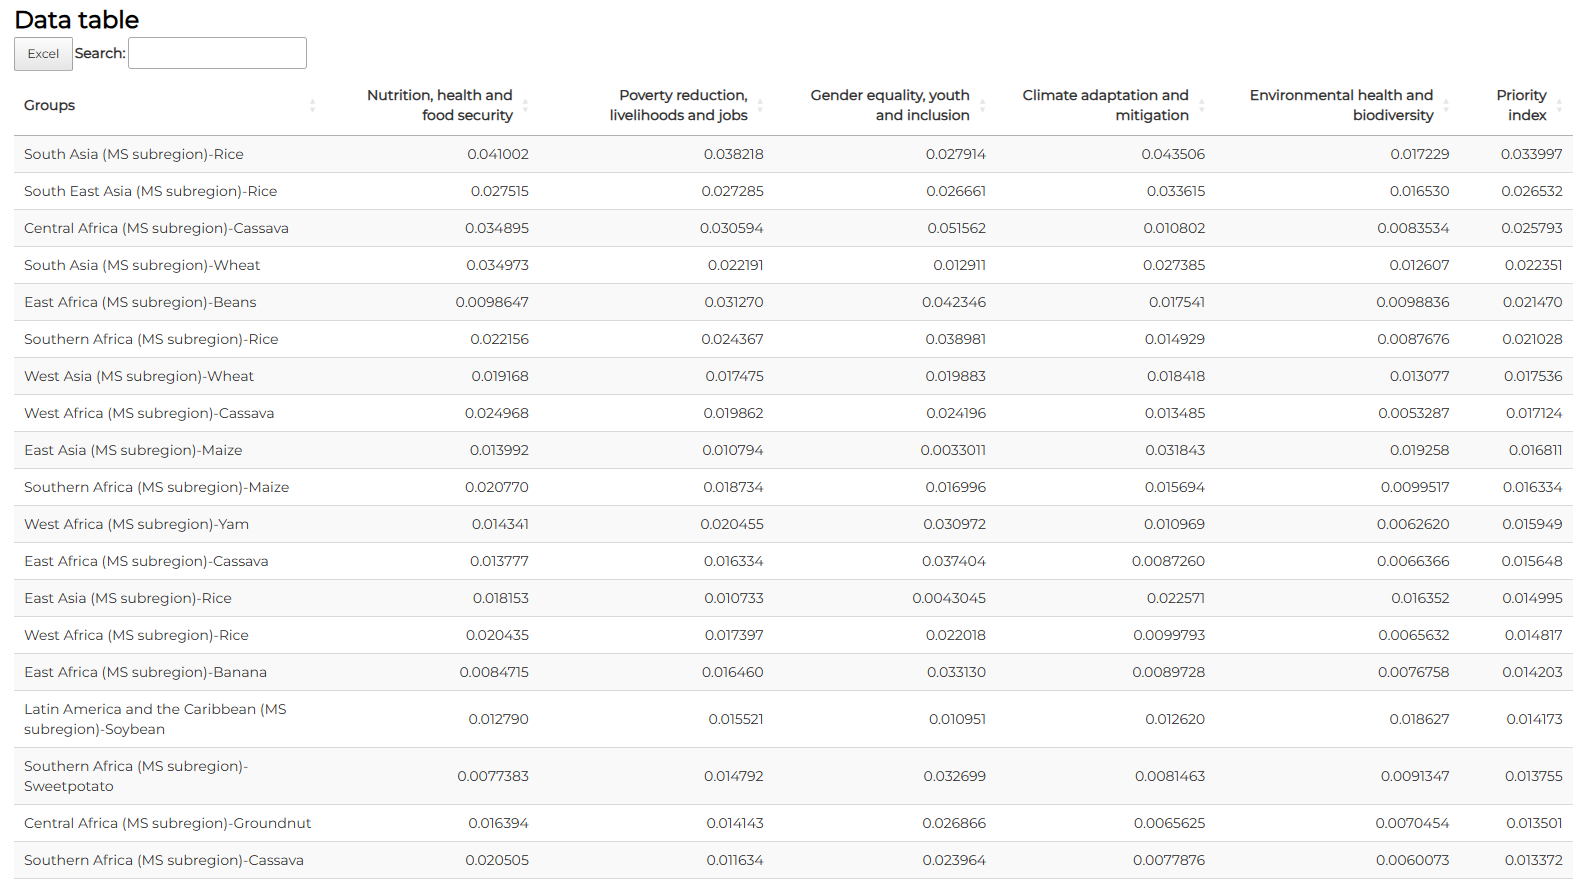
Results of the filter selection are presented in a Treemap and Data table. From the Treemap, we can identify Rice in South and South East Asia, Cassava in Central Africa, Wheat in South Asia, and Beans in East Africa.
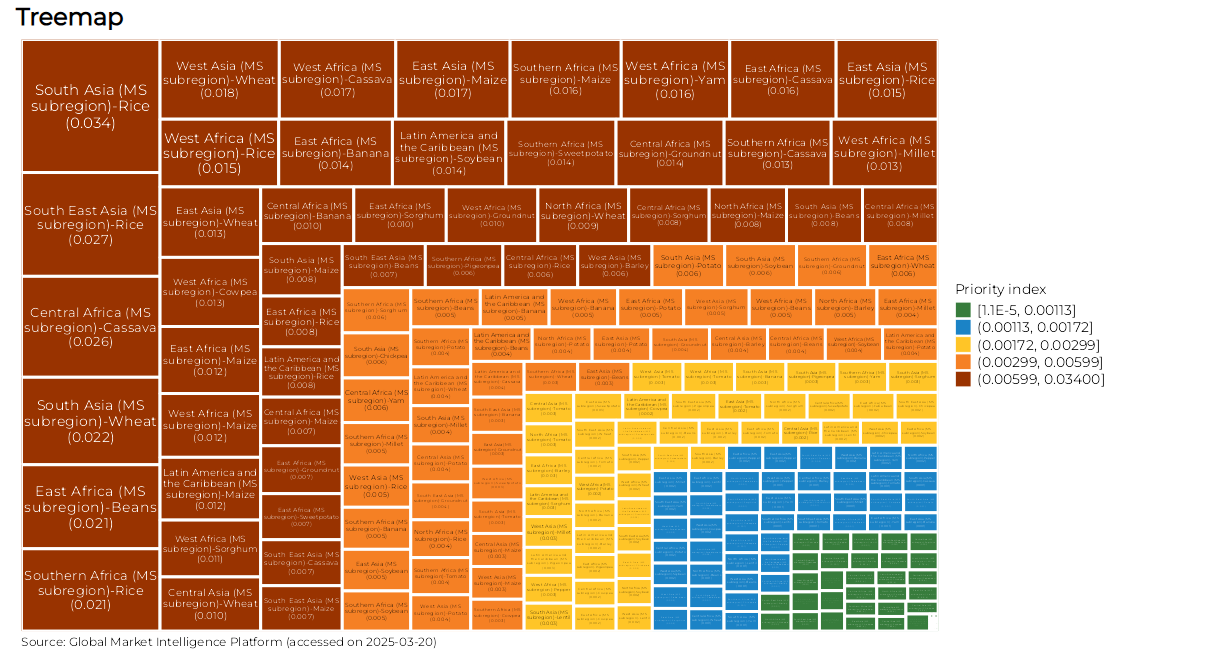
The Data table presents the breakdown of the indexed scores across the five (5) impact areas. We can translate the outcome for South Asian rice, which shows concerns about Climate (0.024), Nutrition (0.023), and Poverty (0.023). Based on this information, we can develop a breeding program that addresses these concerns.
Premise: Crop breeders are often challenged to identify what trait should be prioritized, given the region where a center operates. This section presents a perspective on identifying traits that can be considered (Multi-indicator).
To answer this question, we can set the Impact Opportunities Portal to the Multi-indicator tab and set the following filters to the following:

Note
It is recommended that users set the Dynamic Graphs slider to ON to verify the details within the figures generated in the section. When the slider is activated, the portal generates results longer than usual, so we do not recommend setting Dynamic Graphs in the previous scenarios.
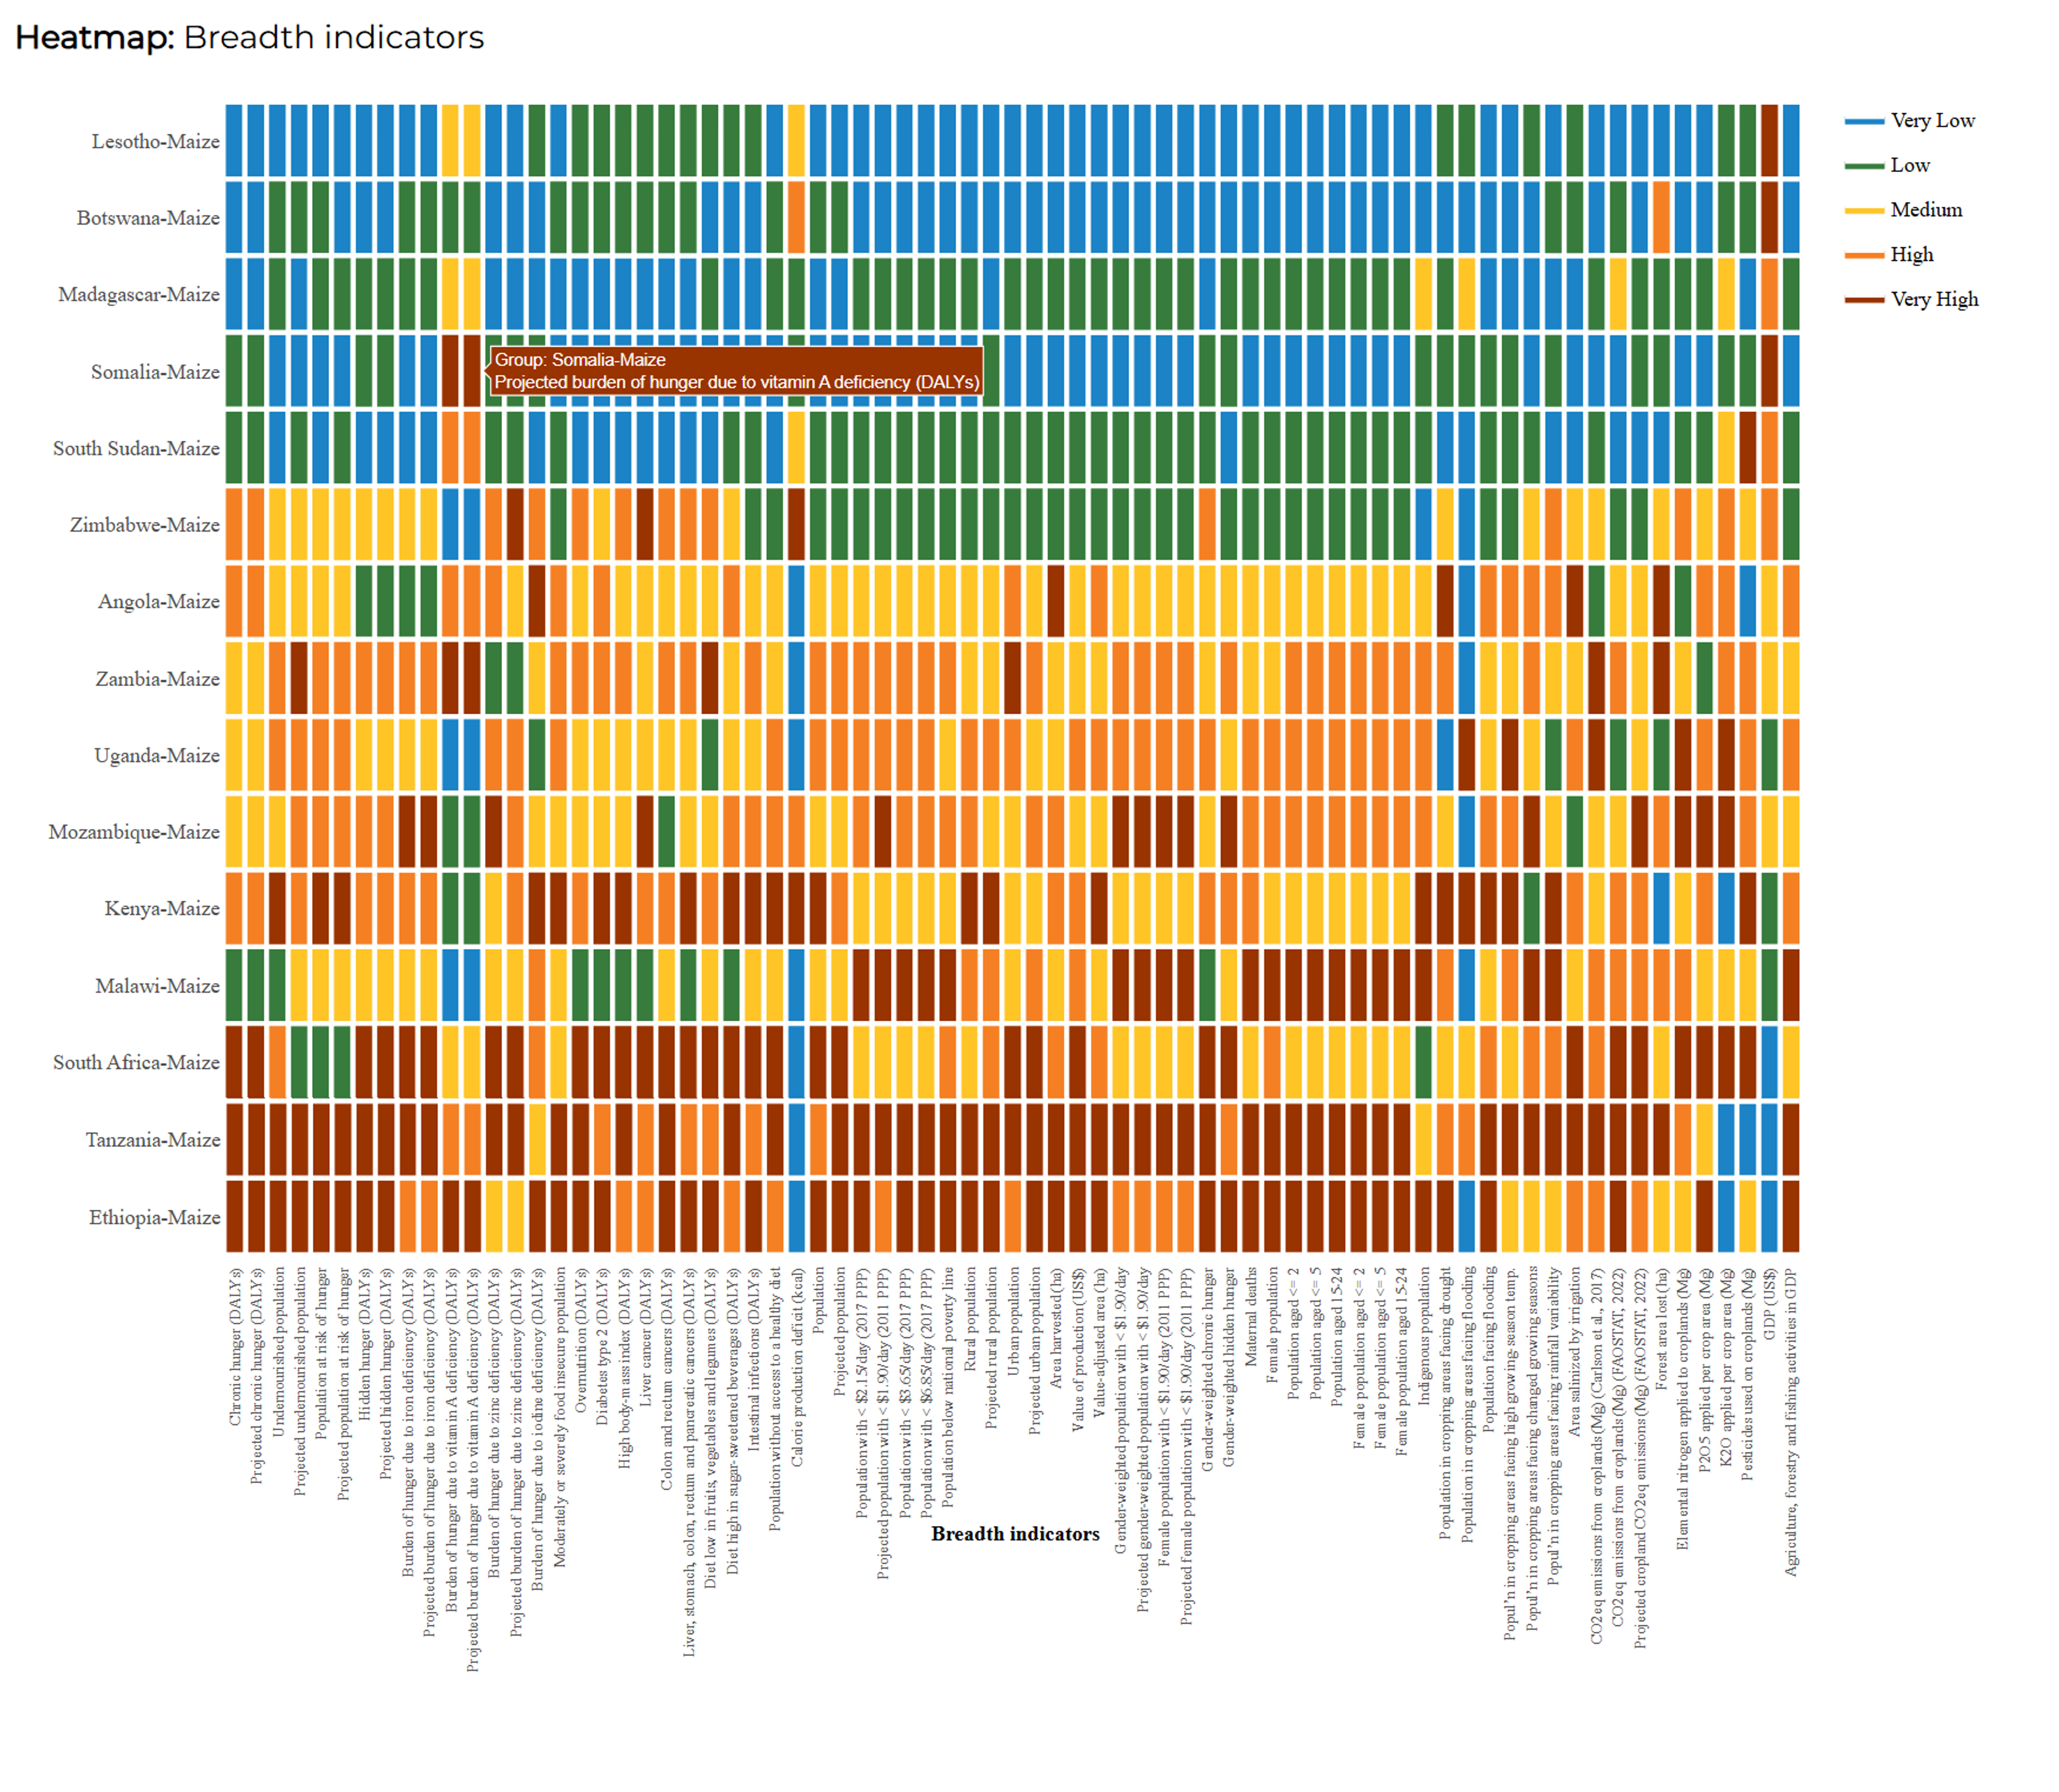
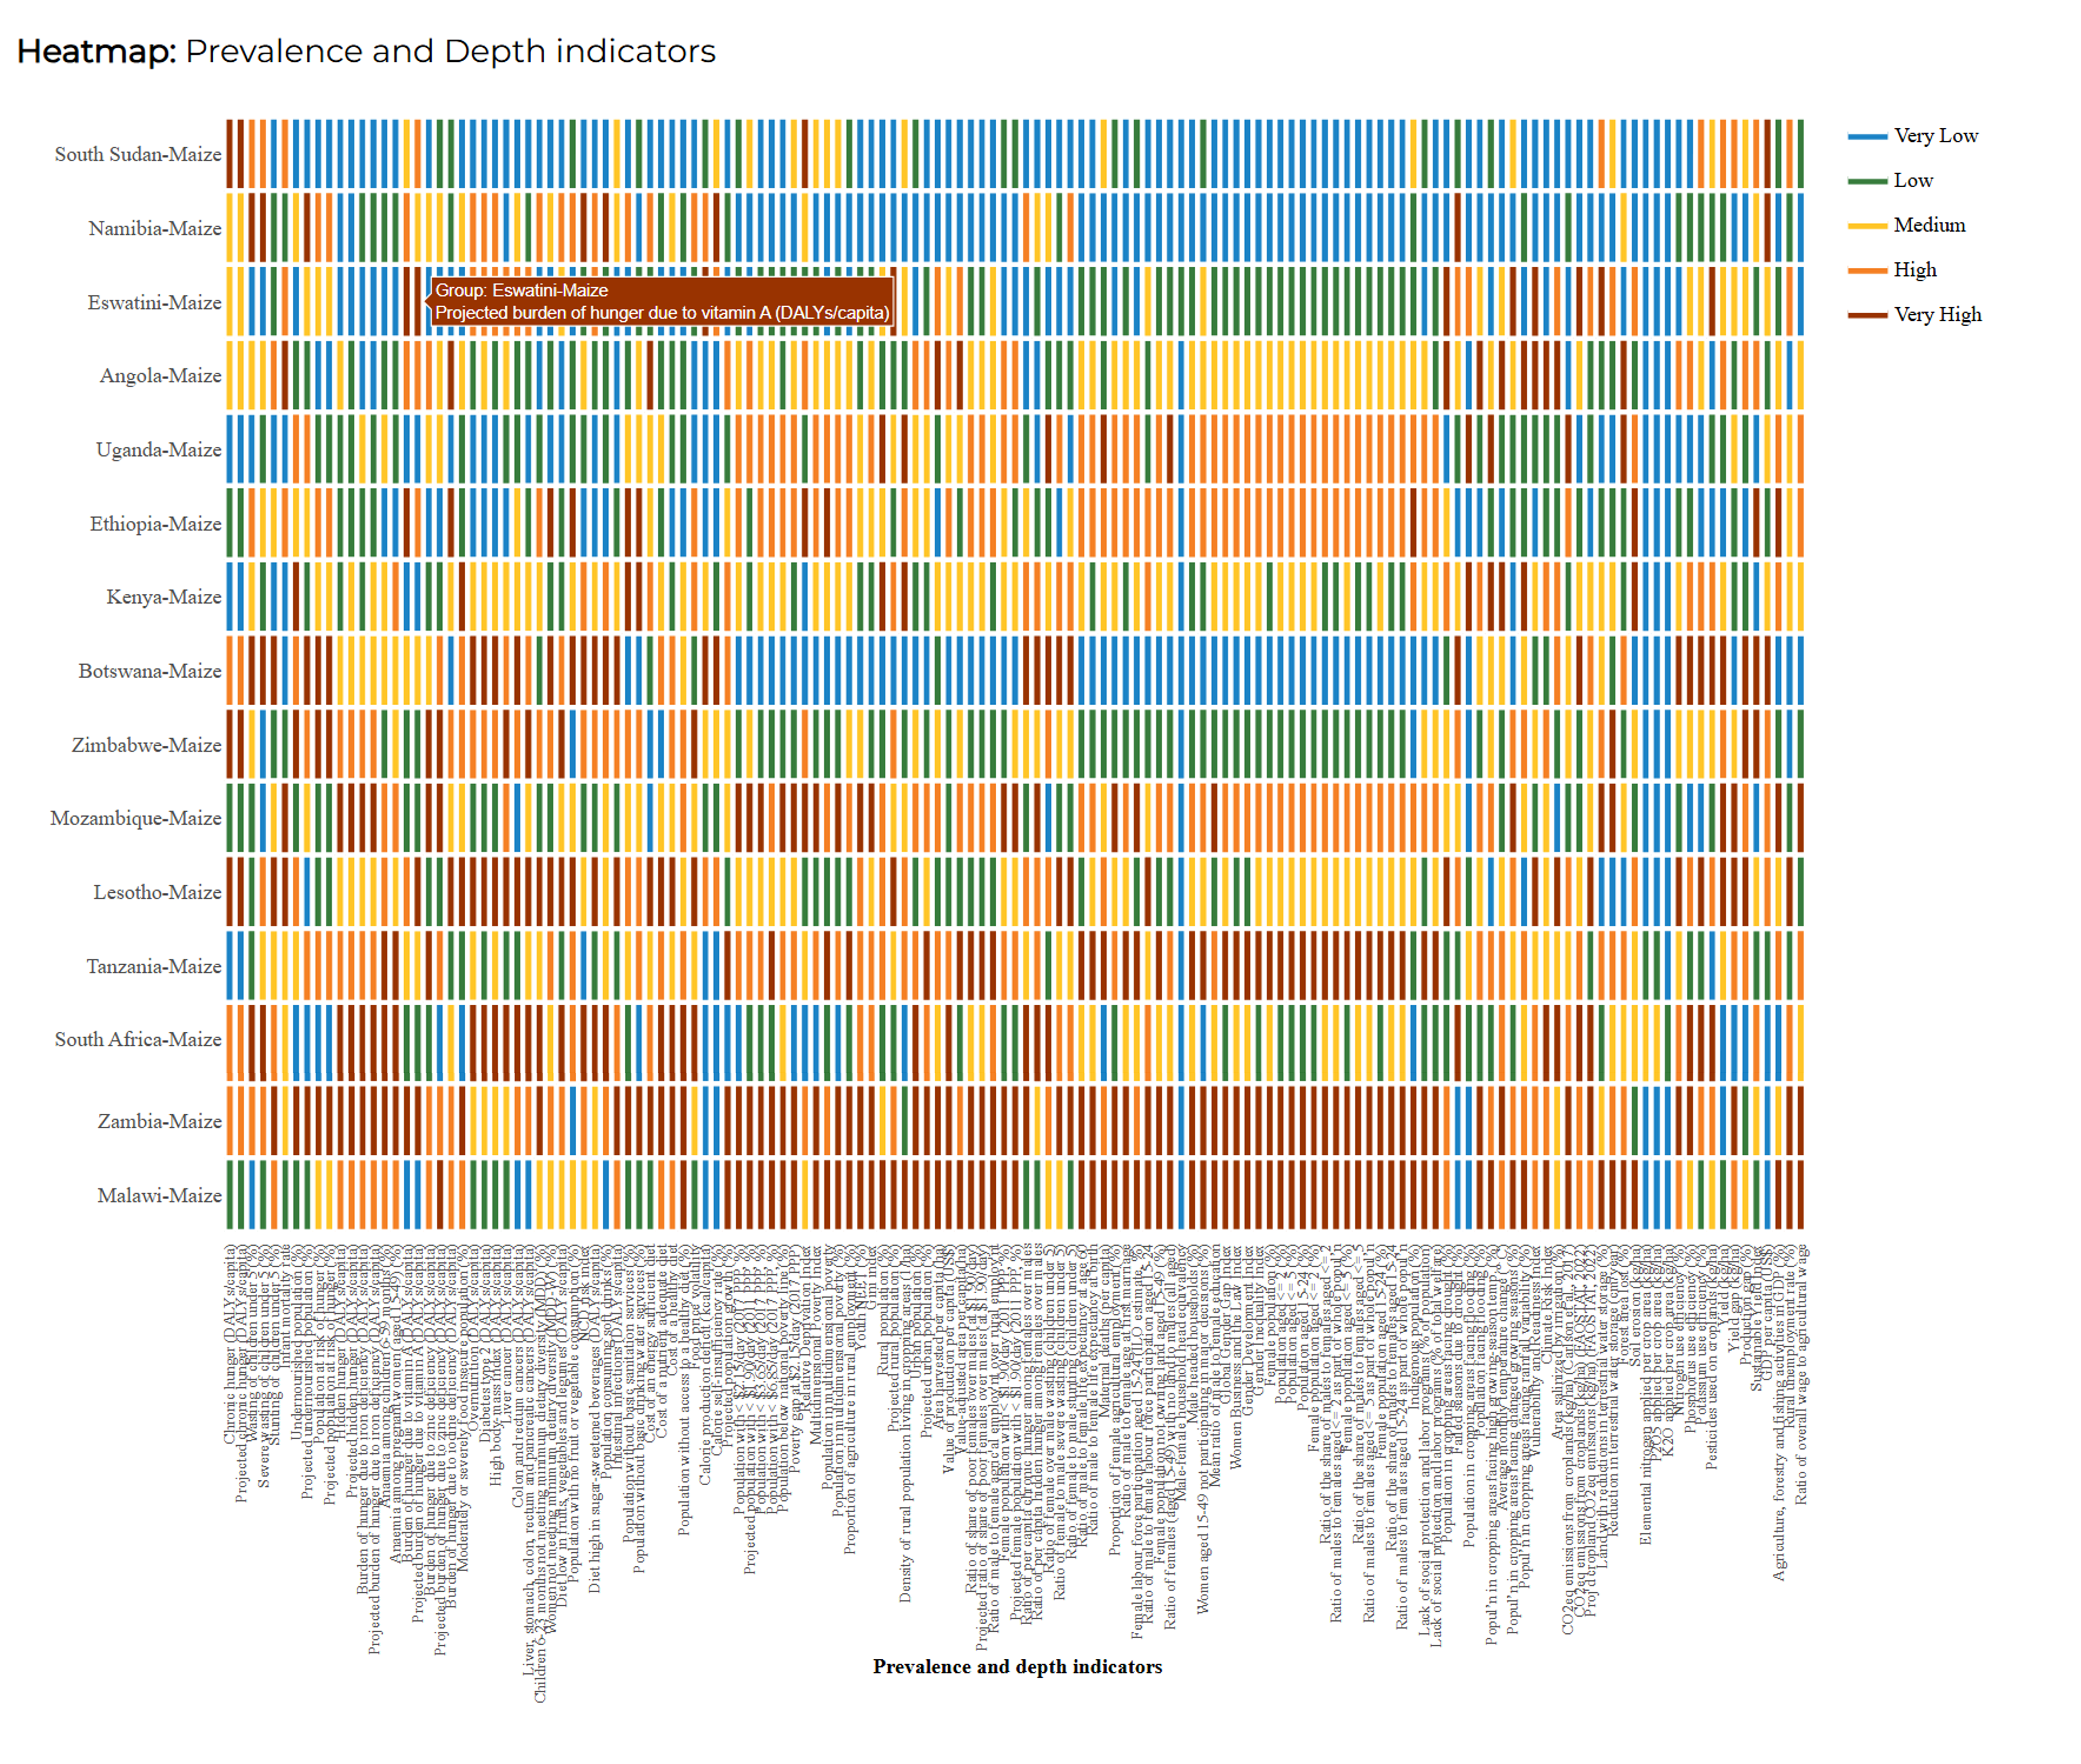
The results of the filter selection present two (2) heatmaps; the indexed valuation across the breadth indicators and depth indicators is presented on the other. As mentioned earlier, breadth indicators collectively value elements in absolute terms. The Breadth indicators heatmap reflects many issues across countries; some show almost all of their indicators set to a “very high” concern. However, some countries pose high concerns for one or four breadth indicators. We can place focus on these countries for this exercise. One item highlighted in Somalia, Zambia, and Ethiopia is a high current and projected index values for vitamin A deficiency. On the other hand, Zimbabwe, South Africa, and Tanzania are projected to incur a high concern in zinc.
We can set a level of consideration for biofortified maize fitted for the identified deficiencies per country.
The heatmap represents indicators that quantify relative values. Within this heatmap, we can view some countries that may not be highlighted in the first heatmap, as their population is relatively small compared to other countries. As such, they may not highlight concerns within the breadth indicator. Eswatini, for example, reported a very high concern in vitamin A deficiency, which is not reflected in the breadth indicator heatmap. Similarly, Malawi also reported a very high concern about zinc deficiency.
Market Segments | SPMS Portal Navigation Guide
The Seed Product Market Segment (SPMS) portal provides a comprehensive profile of the seed market segments aligned with the CGIAR Breeding Hub. It allows the user to view the organization’s breeding efforts from a macro and micro perspective. The SPMS portal showcases more than 600 seed product market segments with market intelligence evidence.
The term defines groups of farmers for a specific market segment. These market segments are determined according to the cultivated crop type and the farming environment, as shown in the table below. SPMS information is presented to the user collectively (Overview tab) and individually (List of Seed Market Segments tab).
Criteria for identification of seed product market segments1
| MS Criteria | Description |
|---|---|
| Crop | Crops in the CGIAR crop breeding portfolio |
| Material type | Hybrid seed production system |
| MS Subregion | Subregion(s) where the crop is grown |
| End use / Consumer product type | Use of the product by processors and consumers (on farm, off farm) |
| Color | Description of the color of the grain, skin, or flesh |
| Production environment | Where the crop is grown (climate, elevation) |
| Production system | How the crop is grown |
| Maturity | Length of time from planting to harvest |
1 Source: https://hdl.handle.net/10883/22248
Navigate to https://glomip.cgiar.org/market-segments
The Overview tab provides a bigger picture of the SPMS by aggregating information from each market segment. The tab is composed of three sections, which are:
The tab offers a detailed profile on each SPMS data curated by the portal. The List of Seed Product Market Segments Tab provides information on its nomenclature, distinct properties, global spread, breeding status, and links to articles related to the SPMS. Information on the tab is mainly subdivided into five (5) sections, which are:
Users are provided with the option to save their search query in CSV or Excel formats.
Note
Aside from saving the query, users can also save the profile information of a specific SPMS in PDF.
The succeeding section of the guide presents a hypothetical scenario in which the SPMS portal is used to aid decision makers.
Note
Users may observe different results from what is presented in the guidelines, as information is being updated in real time. The information presented in the guidelines was captured in May 2025.
Scenario 1.1: Identifying the viability of investing in improving the production performance of cassava in the East and Southern Africa.
Premise: The SPMS portal can verify the market size for proposal writing. This can be useful for private investors and development organizations to identify which breeding program to focus on.
To use the SPMS portal given the scenario, we need to set the filter to the following:
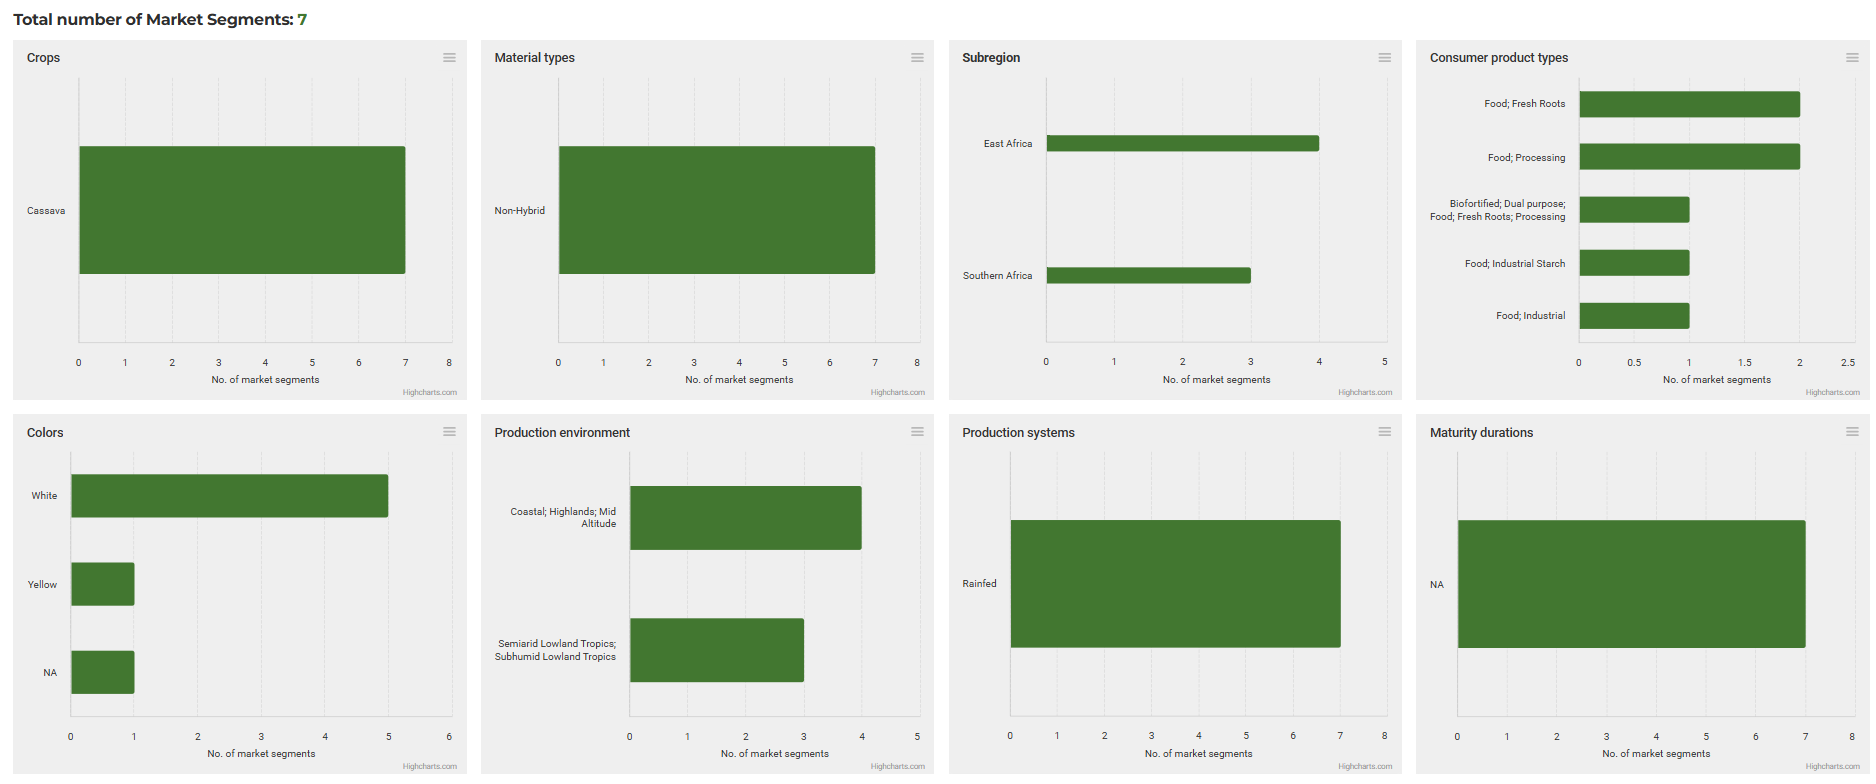
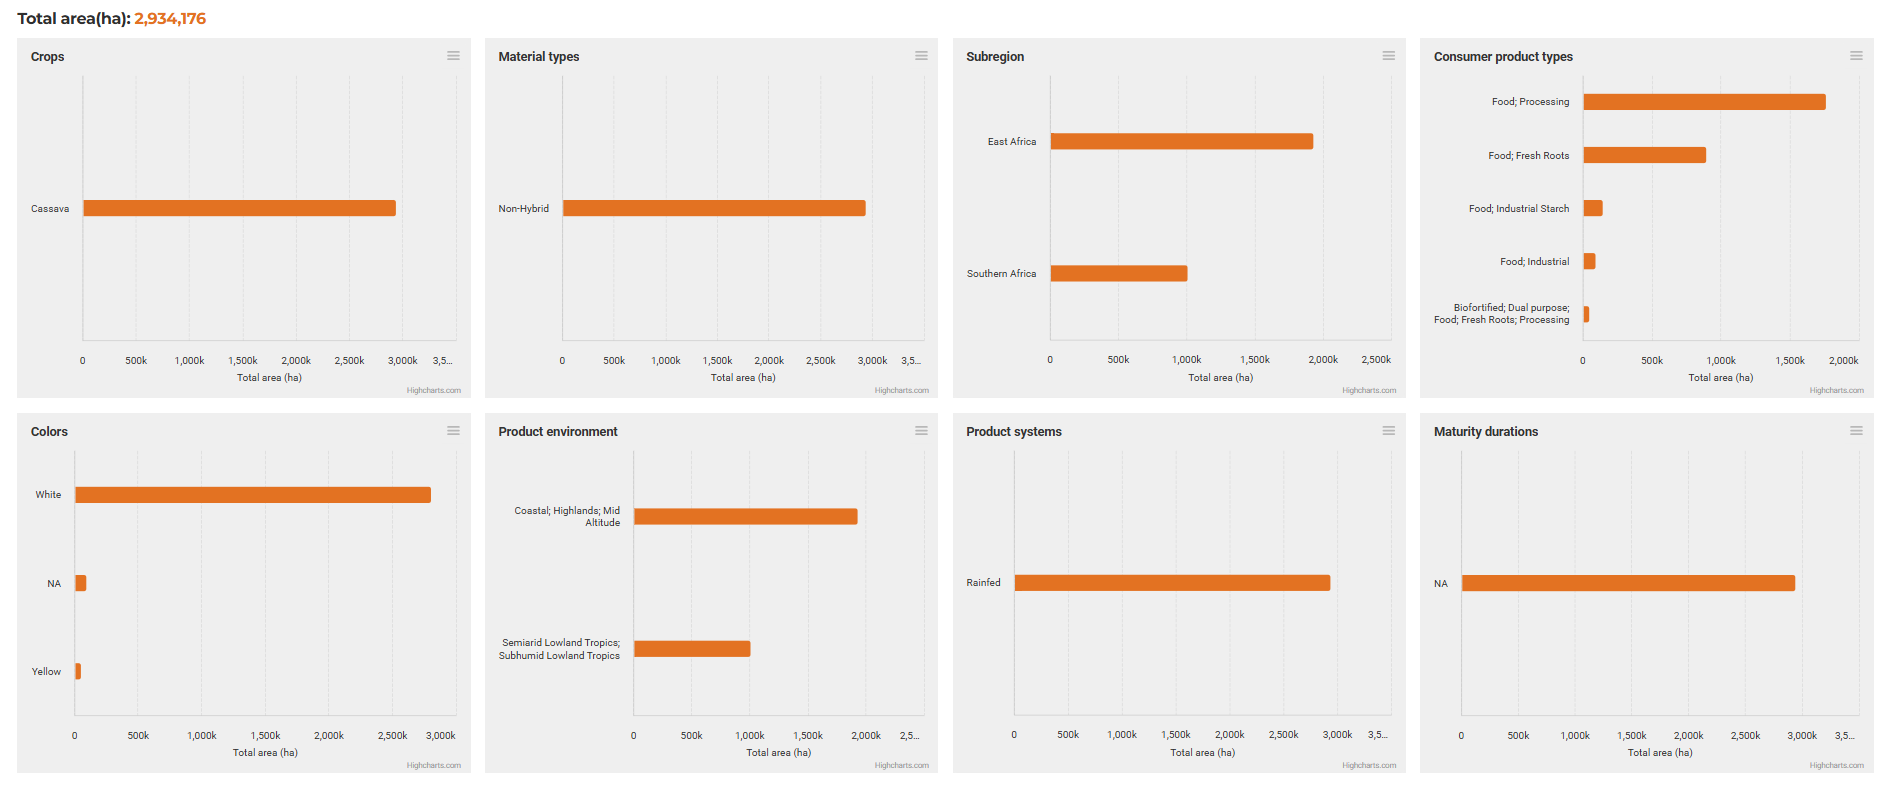
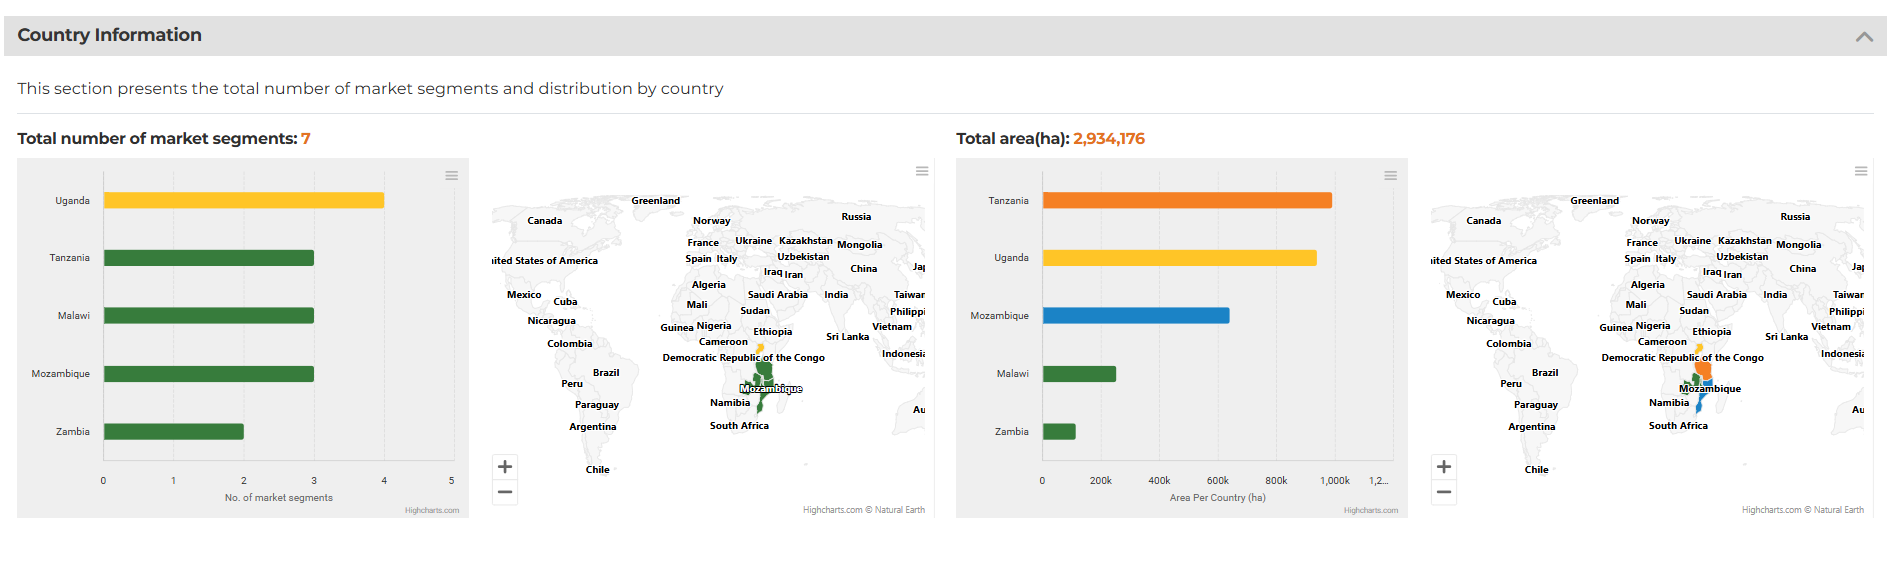
Based on the Overview tab, the filter selection shows that seven (7) Market Segments fit the criteria. 2.9 million hectares are cultivated with non-hybrid rainfed cassava used for food and industrial purposes.
Note
The three-dash icon ![]() at the top right of each graph allows the user to view the figure in full screen or save the chart for later use.
at the top right of each graph allows the user to view the figure in full screen or save the chart for later use.
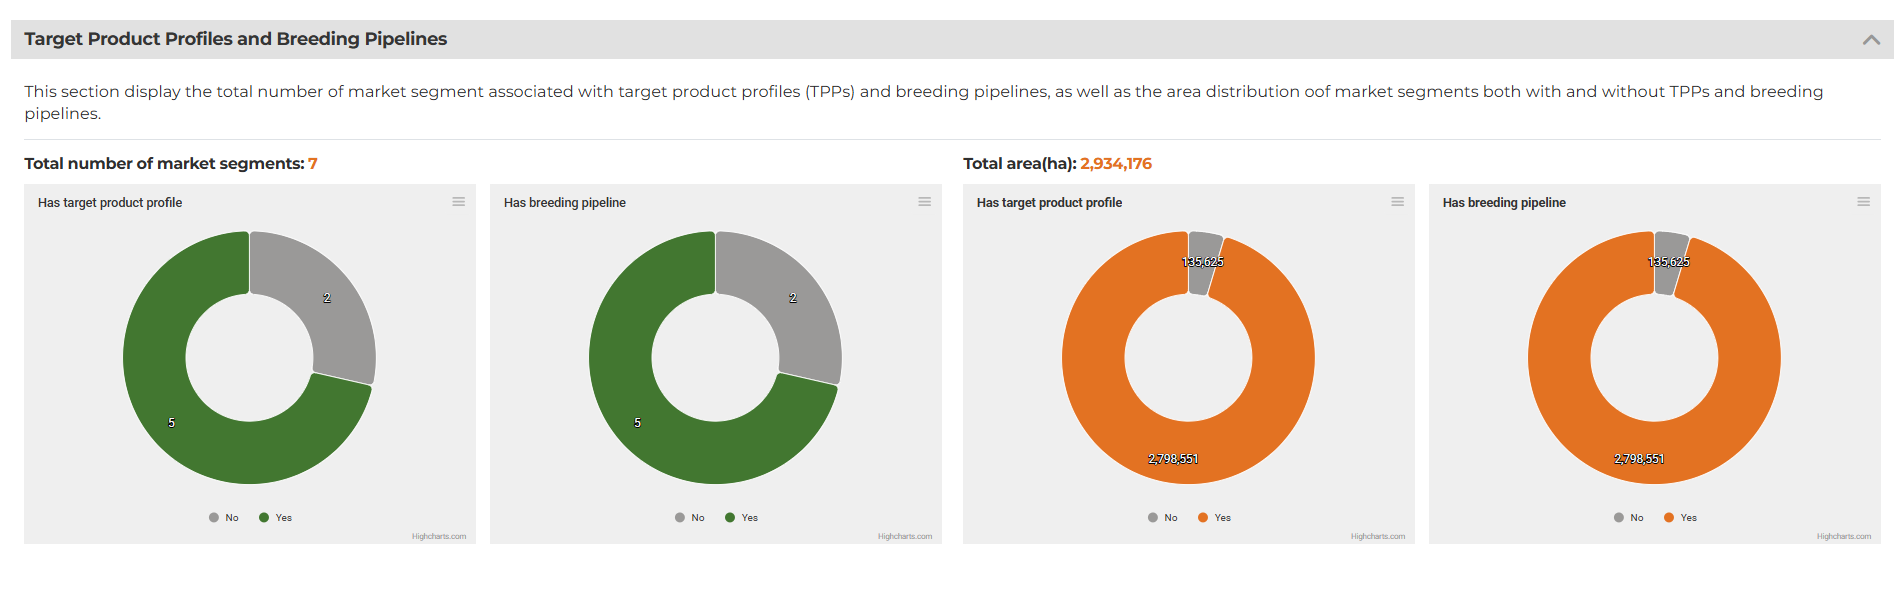
Based on the TPPs and Breeding Pipeline section, out of the seven identified market segments, two (2) have yet to be provided with a breeding pipeline and TPP, constituting about 135.6 thousand hectares.
The country information shows that five (5) countries in the East and Southern African region are associated with the identified market segment: Uganda, Tanzania, Malawi, Mozambique, and Zambia. Further, Tanzania and Uganda were reported to have the highest harvested area, with around 900 thousand hectares in each country.
Scenario 1.2: Identifying the viability of investing in improving the production performance of cassava in the East and Southern Africa (List of Seed Product Market Segments).
Premise: Given the information gathered in the Overview Tab, investors may seek further details regarding the unfunded cassava SPMS in the List of Seed Product Market Segments.
To use the SPMS portal given the scenario, we need to set the filter to the following:
Note
Users may freely switch between Overview and List of SPMS with the initial filter selection intact. To remove the filter selection, press the Reset Filters icon at the end of the filter options.
The selection results returned two (2) entries: the Cassava EAF MS00891 and Cassava SAF MS01070. From the name itself, we can readily identify that the former is an SPMS for East Africa, while the latter is in the South African region.
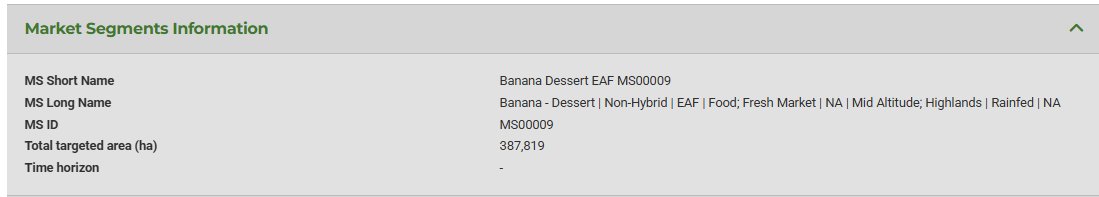
We can compare each market segment using the information provided in each entry. The SAF MS01070 (88.7 thousand ha) segment covers almost twice the area of the EAF MS00891 (46.9 thousand ha) segment.
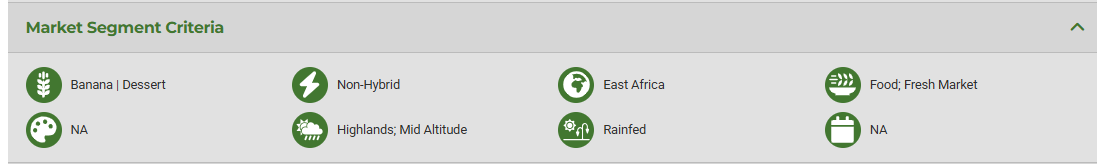
In terms of Market Segment Criteria, a noticeable difference can be observed in the Consumer Product Type category, to which the EAF MS00891 identified that cassava has a variety of purposes.
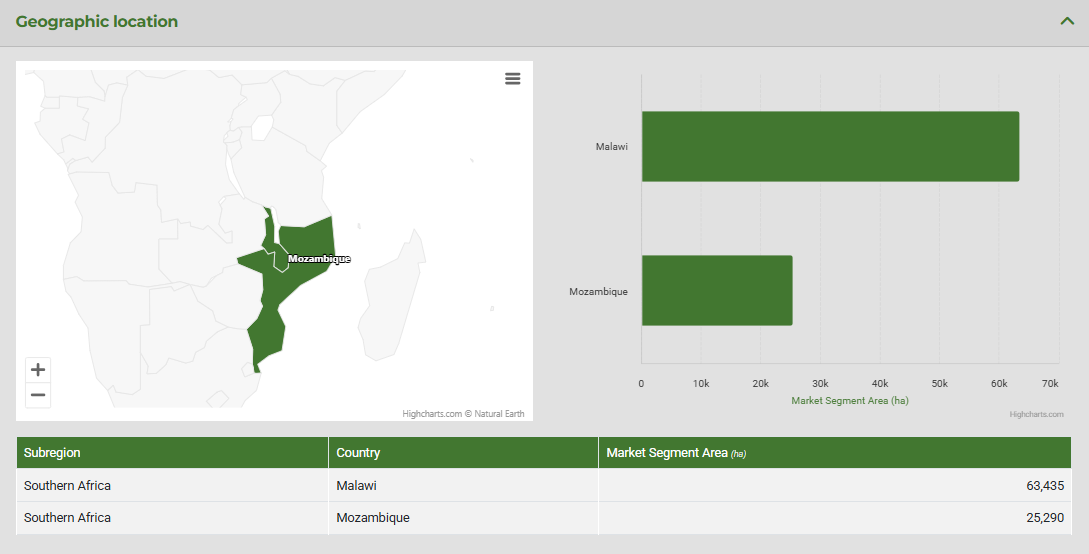
Results regarding the Geographic location show that the EAF MS00891 market segment only covers Uganda, while the SAF MS01070 has Malawi and Mozambique.
Since both SPMS have yet to be funded, the TPP and Breeding Pipeline Information sections are empty. Users may select Funded in the Market Segment filter to check the progress of funded cassava SPMS in East and Southern Africa.
Funded SPMS entries have the TPP and Breeding Pipeline Information section to reflect their TPP Short Name (e.g., Cassava EAF IITA TPP00053) and Breeding Pipeline Name (e.g., Cassava CIAT BP00017). Both names provide a link that, when clicked, leads to the List of Target Product Profiles of the Target Product Profiles portal. For more information about this database, please refer to the Target Product Profiles Navigation Guide.
Scenario 2: Estimating crop areas that still need to be covered for SPMS information (Legumes)
Premise: As mentioned earlier, Market Segment information was derived from refined estimates of the CGIAR. Meanwhile, the National data reflected in the Impact Opportunities portal came from the FAO. Discrepancies between the two datasets may be realized. Observed differences can be perceived as segments that must be explored and identified.
This exercise can be perceived as a quick and practical means of determining what still needs to be covered or updated for the SPMS.
Note
The exercise uses both the Impact Opportunities and MS-SPMS portals. For further information about the Impact Opportunities portal, please check the Navigation Guide.
Impact Opportunities Filter Setup:
SPMS Filter Setup:

Results of the filter setting reported a total harvested area of 11.3 million hectares. Compared with the SPMS Market portal results, which recorded only 8.9 million (21 percent lower), this may indicate checking or recalibrating the estimates for the crop group.